|
Programming Taskbook |
|
|
||
|
Electronic problem book on programming |
||||
|
© M. E. Abramyan (Southern Federal University, Shenzhen MSU-BIT University), 1998–2026 |


|
|
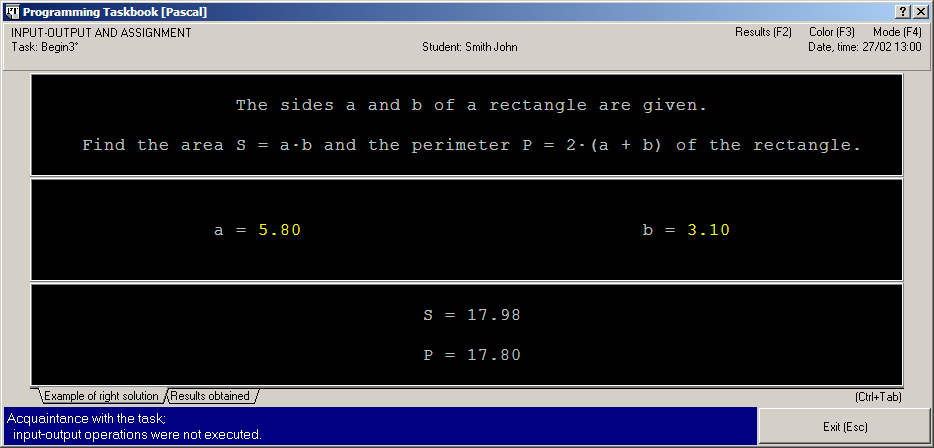
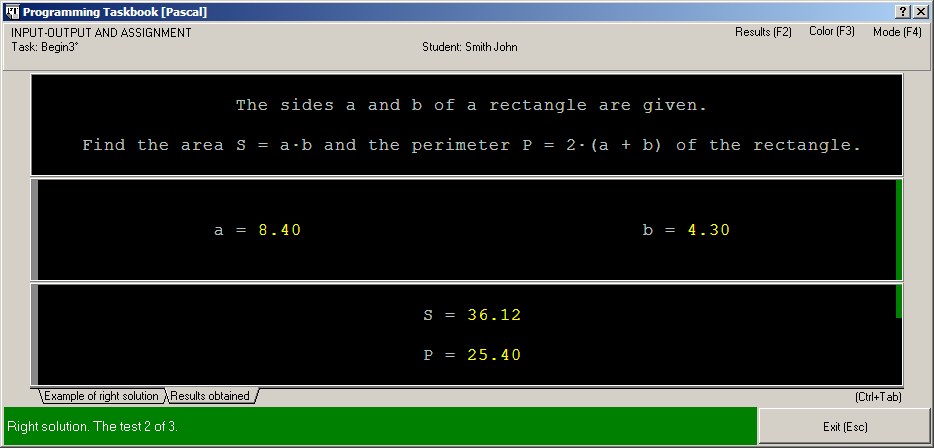
Taskbook windowWhen a project is running then the Programming Taskbook window appears on screen. Starting from the 4.11 version of Programming Taskbook, the two layout modes are enable for the Programming Taskbook window: the older one named the fixed layout mode and the new one (available from the 4.11 version) named the dynamic layout mode. Here is the window for the Begin3 task that is being solved in the Free Pascal Lazarus environment (a name of the used programming language is displayed at the title bar of the window). The fixed layout mode:
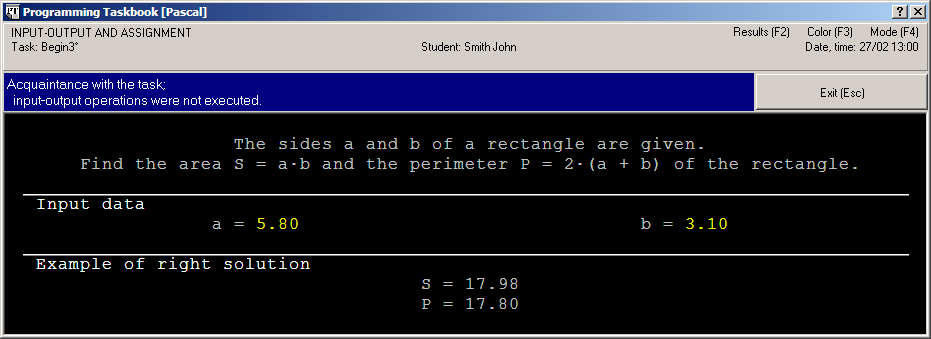
The dynamic layout mode:
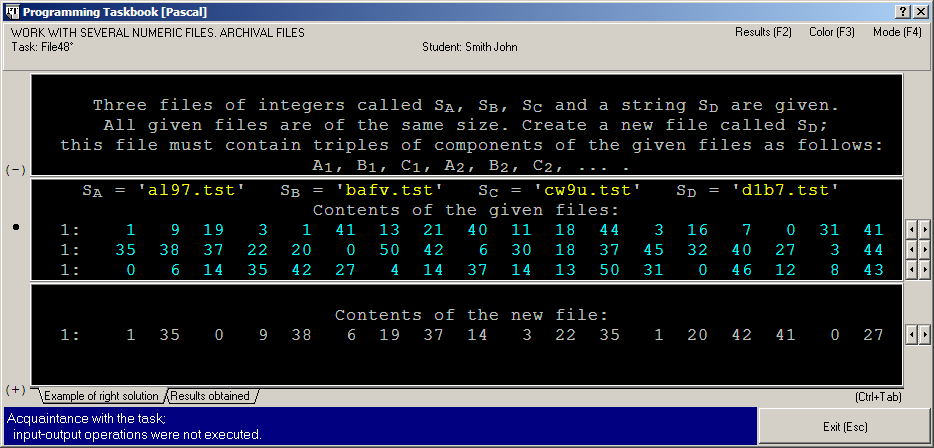
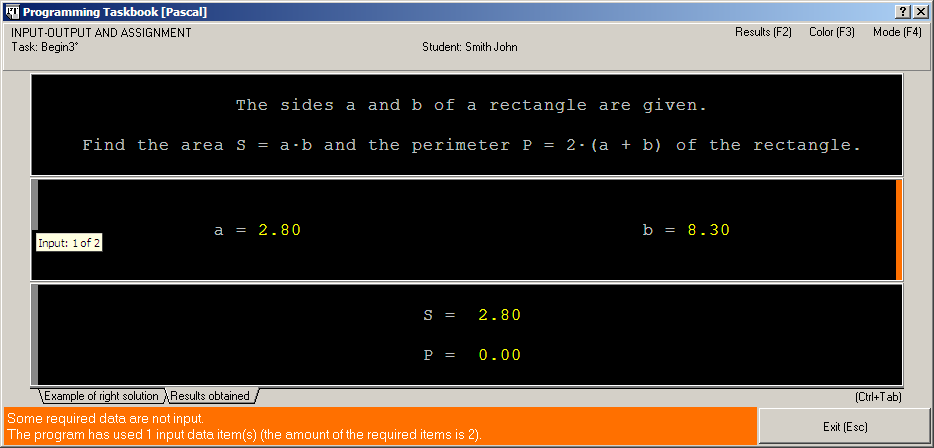
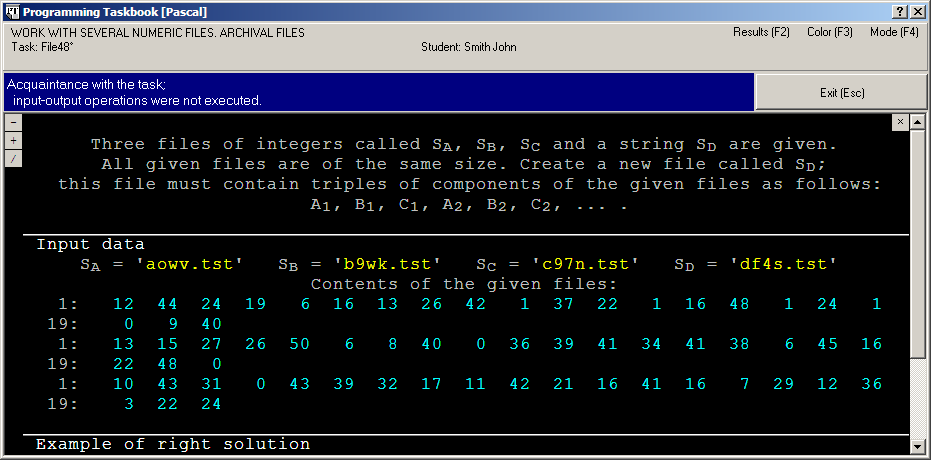
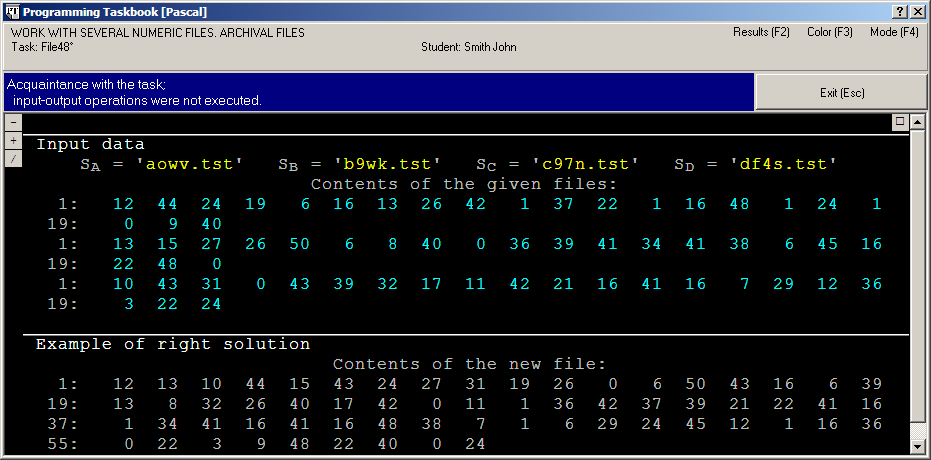
To switch between layout modes you should press the [F4] key or click the "Mode" speed button on the upper-right corner of Programming Taskbook window. The fixed layout modeWe start with the description of the fixed layout mode and then briefly describe main features of the dynamic layout mode. The top of the window contains the following information: the task topic (e.g. "INPUT-OUTPUT AND ASSIGNMENT"), the task name ("Begin3"), personal student information ("Smith John"), date and time of a current program launching ("27/02 13:00"). Tasks that are marked by the symbol "°" are available in the Mini Edition of Programming Taskbook. You can hide date-time info label using the [Ctrl]+[D] hot key. The next panel contains a task text. Below this you see a panel of input data. For the Begin3 task this panel contains a and b real numbers that define lengths of the rectangle sides. Data may be supplied with comments. In this case the comments are "a=" and "b=". The last window panel is a panel of control data and results that has two tabs labeled "Example of right solution" and "Results obtained". If input-output operations are not executed then the "Example of right solution" tab is active; this tab contains the control output data (i.e. correct data). In this case the tab contains the correct values of the area (S) and perimeter (P) of the rectangle. To switch between tabs one should click on a required tab or press [Ctrl]+[Tab] hot key. To distinguish comments from data the color highlighting is used. The comments are highlighted with light-grey color, and the data are yellow. The control data are displayed with the same color as the comments. The status bar and "Exit" button are placed at the bottom of the window To close Programming Taskbook window click the "Exit" button or press [Esc] key or the key that provides a program running; it is [F5], [F6], [F9], [F10], [F11]. If the task text contains more than 5 lines or the task contains file (ot tree) data then the window has scroll buttons that allows to scroll the task text or file components (see the pictures below).
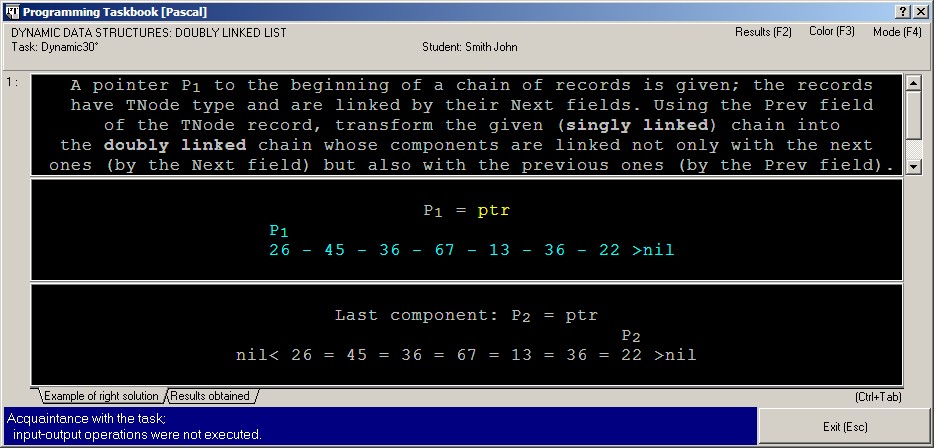
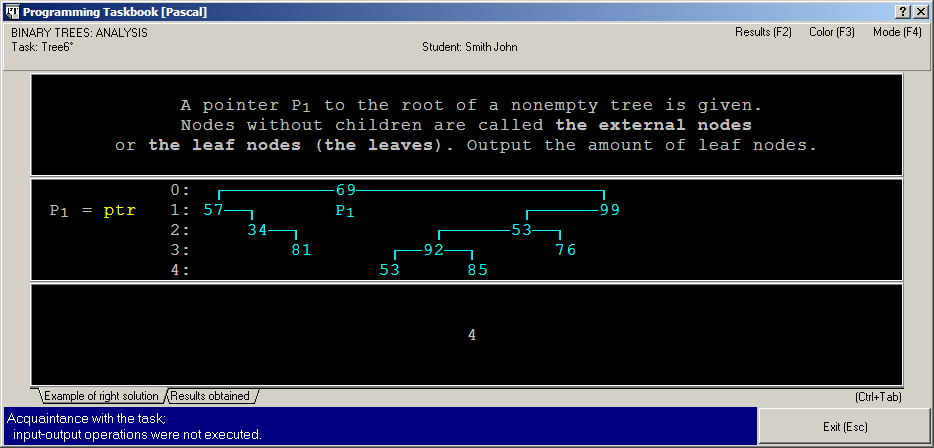
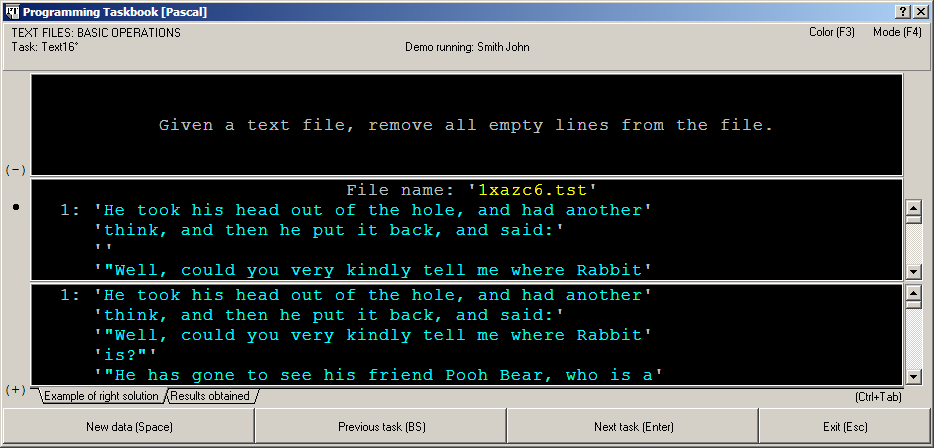
File components are highlighted with light-cyan color to distinguish them from standard input-output data and comments. To scroll file content click one of two scroll buttons If the window contains several scrollable data lists (for example, several files), then scrolling by keyboard is available for a chosen list marked by black circle on the left side of window. To change the chosen scrollable list one should press [+] or [–] key. The [+] key provides circular selection of all scrollable lists from top to bottom, the [–] key provides circular selection in reverse direction. To determine file components that are displayed on screen the marker of a current file position is used. The value of this marker is the order number of the first file component that is displayed on screen. This marker is located at the beginning of a string with the file components list and is separated from the list by colon. The order number of the first element of the file is assumed to be equal to 1. It is necessary to note that the text file lines are displayed at several screen lines whereas the binary file components are displayed at one screen line. Also you can scroll a task text. The marker of a current position is located on the left of the panel with the task text. It contains a number of a first text line that is displayed on screen. If the marker is underlined then the further scrolling is impossible (see picture). The Programming Taskbook window can display special elements of input and output data: chains of nodes and trees. These elements are used in the Dynamic and Tree task groups (see pictures below).
When the program is running in the demo mode additional buttons are displayed at the bottom of the window. They provide access to the next or previous task of a chosen task group and allow to browse a various sets of input and control data for a chosen task. The "Example of right solution" tab is always active in the demo mode.
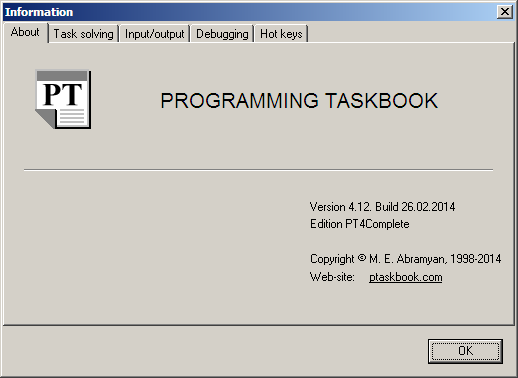
When the window is active you can press key [F1] to get information about a version of Programming Taskbook, data types which should be used in the solutions of tasks, and additional information about tasks initialization and data input-output. The information window content depends on a chosen programming language. Screenshots of Help windows are placed at the beginning of the sections devoted to the Pascal, C++, C#, Visual Basic .NET, F#, Python, Java, Ruby and Julia programming languages.
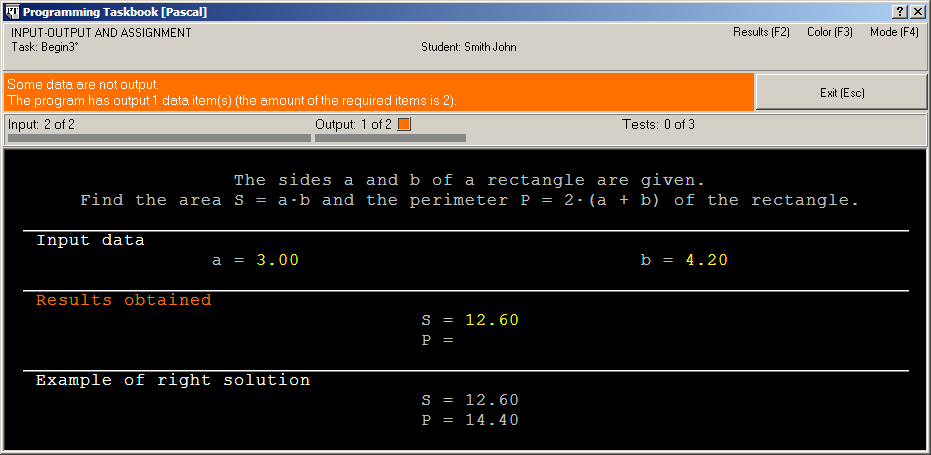
Some additional features implemented in the 4.11 versionIn the 4.11 version the window interface was supplied by additional features available both in fixed and dynamic layout mode. Extended color representation of errorsAlong with the "ordinary" red color that indicates wrong solution, there are provided three additional colors of red tones that indicate one of three types of input-output errors. 1. Insufficient data input or output (orange background):
2. Attempt to input or output superfluous data (crimson background):
3. Attempt to input or output data of wrong type (magenta background):
4. Other errors (red background):
Input-output indicators and solution progress indicatorNear the left and right border of the panels of input data and results the additional indicators (vertical color bands) are located (the similar indicators for dynamic layout mode have vertical orientation and are placed on the special panel of indicators—see the next section). The left-hand indicators show percentage of data being input and output. Additional information displays on the hints when the mouse cursor enters these indicators (see picture below). The left-hand indicators are of dark-gray color.
The right-hand indicators are of two types: red-tone indicators of input-output errors and green indicator of solution progress. The input error indicator is located on the panel of input data (see the previous picture), whereas the output error indicator is located on the panel of results. The solution progress indicator shows percentage of successful tests; it is located on both data panels of Programming Taskbook window:
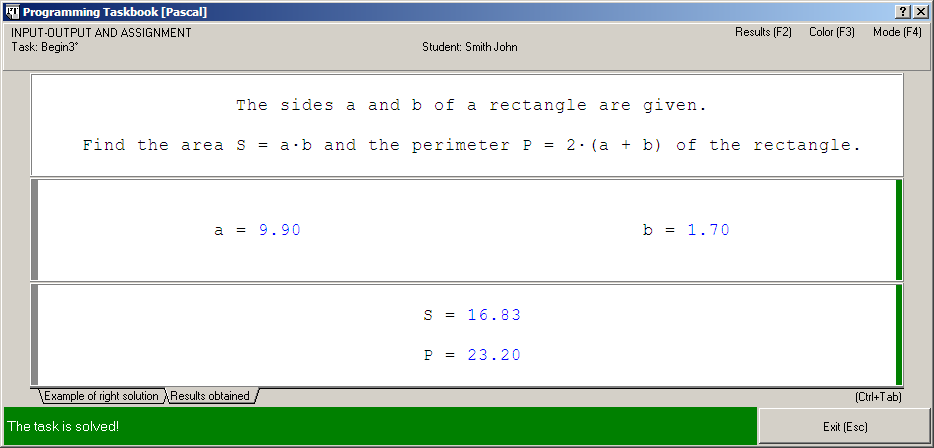
Switching layout mode and color schemeThe [F4] key and the "Mode" speed button placed on upper-right corner of the Programming Taskbook window allow to switch between the fixed layout mode and the dynamic layout mode (see the description of the fixed layout mode in the previous section and the description of the dynamic layout mode in the next section). The [F3] key and the "Color" speed button placed near the "Mode" speed button allow to switch between the "black" color scheme of the Programming Taskbook window (light symbols on the black background) and the "white" color scheme (dark symbols on the white background). The "white" color scheme is less contrast in comparison with the "black" scheme but it allows to create printable screenshots of greater clarity (see the picture below).
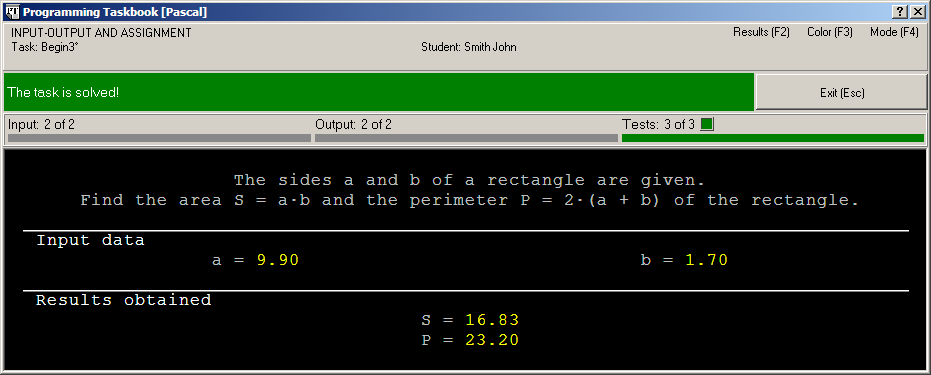
All windows settings are saved in the pt4.ini file in the working directory and are restored during subsequent program launches. Fast browsing of resultsThe PT4Results tool may be launched directly from the Programming Taskbook window by means of the [F2] key or the "Results" speed button placed on upper-right corner of the window. This feature is not available in the demo mode. The dynamic layout modeIn the dynamic layout mode the height of all task panels of Programming Taskbook window is determined by contents of these panels and the scrolling is available for the window as a whole. In the dynamic layout mode the status bar and buttons are located at the upper part of the window because the total height of window may be changed for different tasks (and even for different test launches of the same task). The window in the dynamic layout mode may contain from two to four main panels in various combinations: the panel with the task text (without title), the panel of input data (with the title named "Input data"), the panel with results (with the title "Results obtained") and the panel with example of correct results (with the title "Example of right solution"). The panels with the task text and input data are always displayed. In the case of demo mode and when input-output operations are not executed, the panel with correct example is displayed and the (empty) panel with results is not. In the case of successful test running the panel with correct example is not displayed because in this case its contents would be the same as the contents of the result panel. All panels are displayed when some error was revealed during the program running.
In the dynamic layout mode all indicators are placed on the indicator panel that is located under the status bar. The indicator panel is not displayed in the demo mode and when input-output operations are not executed. Along with the indicators the indicator panel contains additional colored labels. The green label is displayed over the solution progress indicator when the task is successfully solved (that is, when the required amount of tests was successfully executed). The red-toned labels are displayed over the some indicator when some error was detected (the input errors are marked by label placed over the input indicator, the output errors are marked by label placed over the output indicator, other errors are marked by label placed over the solution progress indicator. Any input-output error also marked by red-toned color of the title of the corresponding panel (see picture below).
If the total height of panels exceeds the height of the Programming Taskbook window then the scroll bar is displayed near the right bound of the window (see picture below). The height of the window may be increased or decreased by the [Ctrl]+[Up] or [Ctrl]+[Down] respectively (or by dragging the window caption up or down). To scroll the contents of the window you may use the [Home], [End], [PgUp], [PgDn], [Up] and [Down] keys, scroll bar and also the mouse wheel.
You can hide the panel with task text by double-clicking in any point of this panel or by pressing the [Del] key. That action allows to show more information from other window panels:
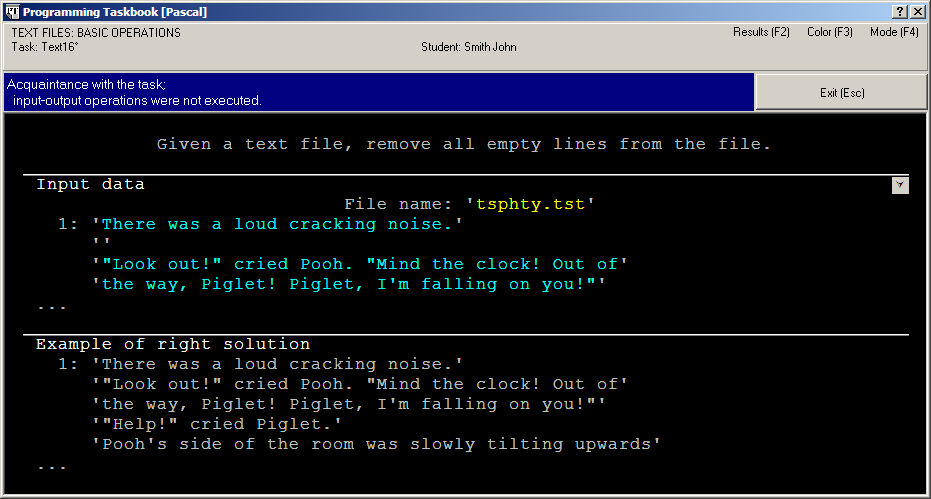
To restore the panel with task text you may perform the same actions. In the dynamic layout mode all "scrollable" task items (that is, task text, binary files, trees) are fully displayed in window panels; only text files may be partially displayed:
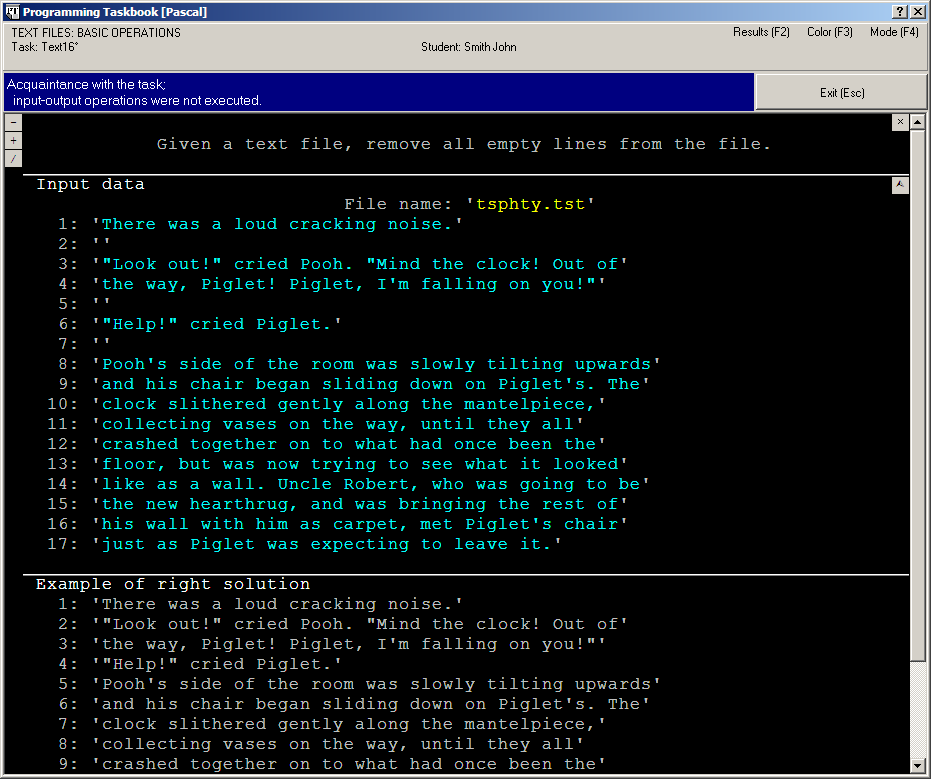
You can display full contents of text files by double-clicking in any point of the panel of input data or results or by pressing the [Ins] key:
To restore the brief contents of text files you may perform the same actions. Along with the "ordinary" scrolling you can perform the "smart" scrolling using the [–], [+], [/] keys or speed buttons with the corresponding captions located in the upper-left corner of the panel with task text (see the previous picture). The [–] key (and the corresponding speed button) scrolls the window contents to the top of the previous panel, the [+] key (and the corresponding speed button) scrolls the window contents to the top of the next panel (the panels are selected cyclically). The [/] key (and the corresponding speed button) allows to switch between the panel with results and the panel with the example of the right solution. List of hot keysHot keys available in any layout mode: [Esc]—close the windows [Enter]—next task (in the demo-run) [Backspace]—previous task (in the demo-run) [Space]—new data sample (in the demo-run) or hide/show the task panels (if the debug panel is shown) [F1]—show the information window [F2]—show the results window (not in the demo-run) [F3]—black/white background color [F4]—fixed/dynamic layout mode [Ctrl]+[D]—show/hide the current date and time [Alt]+[+], [Alt]+[–]—increase/decrease font size in the debug panel [Ctrl]+[C]—copy the curent contents of the debug panel into the Windows clipboard. Additional hot keys available in the fixed layout mode: [/] or [Ctrl]+[Tab]—switching between the "Example of right solution" tab and "Results obtained" tab [Up], [Down], [Left], [Right], [Home], [End], [PgUp], [PgDn]—data scrolling in the task panels (if the panels contain scrollable items) [+] or [Ctrl}+[PgDn], [–] or [Ctrl}+[PgUp]—move to next/previous scrollable item in the task panels (if the panels contain more than one scrollable item) [Alt]+[Up], [Alt]+[Down], [Alt]+[Home], [Alt]+[End], [Alt]+[PgUp], [Alt]+[PgDn]—data scrolling in the debug panel [Alt]+[Left], [Alt]+[RIght]—move to previous/next tabbed page in the debug panel (when parallel MPI program runs) [*], [0]–[9], [A]–[Z]—tabbed page selection in the debug panel ([*]—all processes page, [0]–[9]—processes 0–9 pages, [A]–[Z]—processes 10–36 pages). The [Alt]-key may be omitted if the task panels are hidden or do not contain scrollable items. Additional hot keys available in the dynamic layout mode: [/] or [Ctrl]+[Tab]—switching between the "Example of right solution" panel and "Results obtained" panel (if scrolling is available in the task panels) [Up], [Down], [Home], [End], [PgUp], [PgDn]—vertical data scrolling (if scrolling is available in the window) [+] or [Ctrl}+[PgDn], [–] or [Ctrl}+[PgUp]—scroll to next/previous task panel (if scrolling is available in the task panels) [Ctrl]+[Up], [Ctrl]+[Down]—moving up/down the upper bound of the window [Ctrl]+[+], [Ctrl]+[–]—increase/decrease font size in the task panels [Del]—hide/show the panel with task text [Ins]—partial/full visualization of text file data.
|
 located on the right of a corresponding screen line.
It is possible to scroll data list with keyboard. For scrolling by one item press [Right] or [Down] (scrolling forward)
and [Left] or [Up] (scrolling backward). For scrolling by group of items press [Ctrl]+[Right] or [PgDn]
(scrolling forward) and [Ctrl]+[Left] or [PgUp] (scrolling backward).
The [Home] key allows to move to the beginning of a data list and the [End] key allows to move
to the end of a data list.
located on the right of a corresponding screen line.
It is possible to scroll data list with keyboard. For scrolling by one item press [Right] or [Down] (scrolling forward)
and [Left] or [Up] (scrolling backward). For scrolling by group of items press [Ctrl]+[Right] or [PgDn]
(scrolling forward) and [Ctrl]+[Left] or [PgUp] (scrolling backward).
The [Home] key allows to move to the beginning of a data list and the [End] key allows to move
to the end of a data list.


|
|
Designed by |
Last revised: |